
Bitcoin’s rally has stalled around the $90,000 level, which is acting as a significant technical and psychological resistance point. Pushing beyond this price depends on several factors, including a return of strong institutional demand, improving macroeconomic conditions, and a clear technical breakout.
The token has settled into a trading range of roughly $85,000 to $90,000 following an October crash that has put it on pace for the first annual loss in three years. Bitcoin is down about 5% since last December, after being up around 30% while hitting an all-time high in early October.
Factors Hindering the Breakout
Weak Demand and Liquidity: The primary reason for the stall is a lack of sustained demand and thin market liquidity, particularly during the recent year-end holiday period.
Institutional Outflows: Spot Bitcoin ETFs experienced net outflows in the last weeks of December 2025, suggesting caution among institutional investors and profit-taking.
Macroeconomic Uncertainty: Broader economic factors, such as central bank policies and global inflation risks, continue to weigh on investor sentiment and contribute to volatility.
Technical Resistance: The $90,000 to $92,000 range is a critical resistance area on technical charts; repeated attempts to breach it have failed, leading to consolidation
Potential Catalysts for a Further Push
Sustained ETF Inflows: A decisive return to net inflows into spot Bitcoin ETFs in early 2026 would signal renewed institutional buying interest, which is seen as a key driver for future price appreciation.
Clear Technical Breakout: A sustained daily or weekly close above the $90,000 resistance level and the subsequent $94,000 mark is considered crucial by analysts to confirm a new bullish momentum toward targets like $110,000 and eventually $122,000.
Favorable Macro Environment: An easing of macro uncertainty, such as potential interest rate cuts or positive inflation data from the US, could improve market liquidity and risk appetite, benefiting Bitcoin as a “digital gold” or alternative asset.
Post-Halving Dynamics: Historically, significant price appreciation occurs in the 12-18 months following a Bitcoin halving event (the last one was in April 2024), suggesting that 2026 could still see a strong upward trajectory if historical patterns hold.
Expert outlook
Analysts are broadly split on the near-term trajectory but remain cautiously bullish long-term. While some foresee a potential short-term dip if key support levels around $86,000 are broken, the consensus for late 2026 generally ranges from $120,000 to $170,000, with more optimistic projections aiming for as high as $250,000.
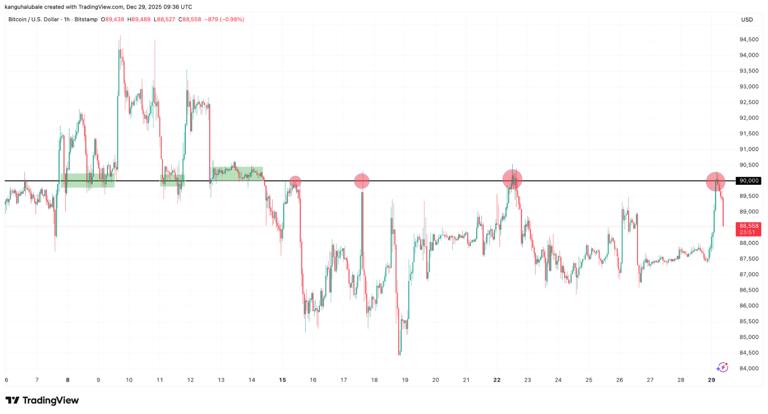
Bitcoin’s bullish case now hinges on bulls overcoming the resistance at $90,000, an area that acted as formidable support in early December. The price has been rejected four times from this level since Dec. 15, as shown in the chart below.
Since the price is still holding the support at $84,000, momentum should start to return once the bulls reclaim the $90,000-$92,000 zone.
The market is currently in a phase of consolidation, balancing between short-term caution and strong long-term structural demand.
This article does not contain investment advice or recommendations.

Leave a Reply